
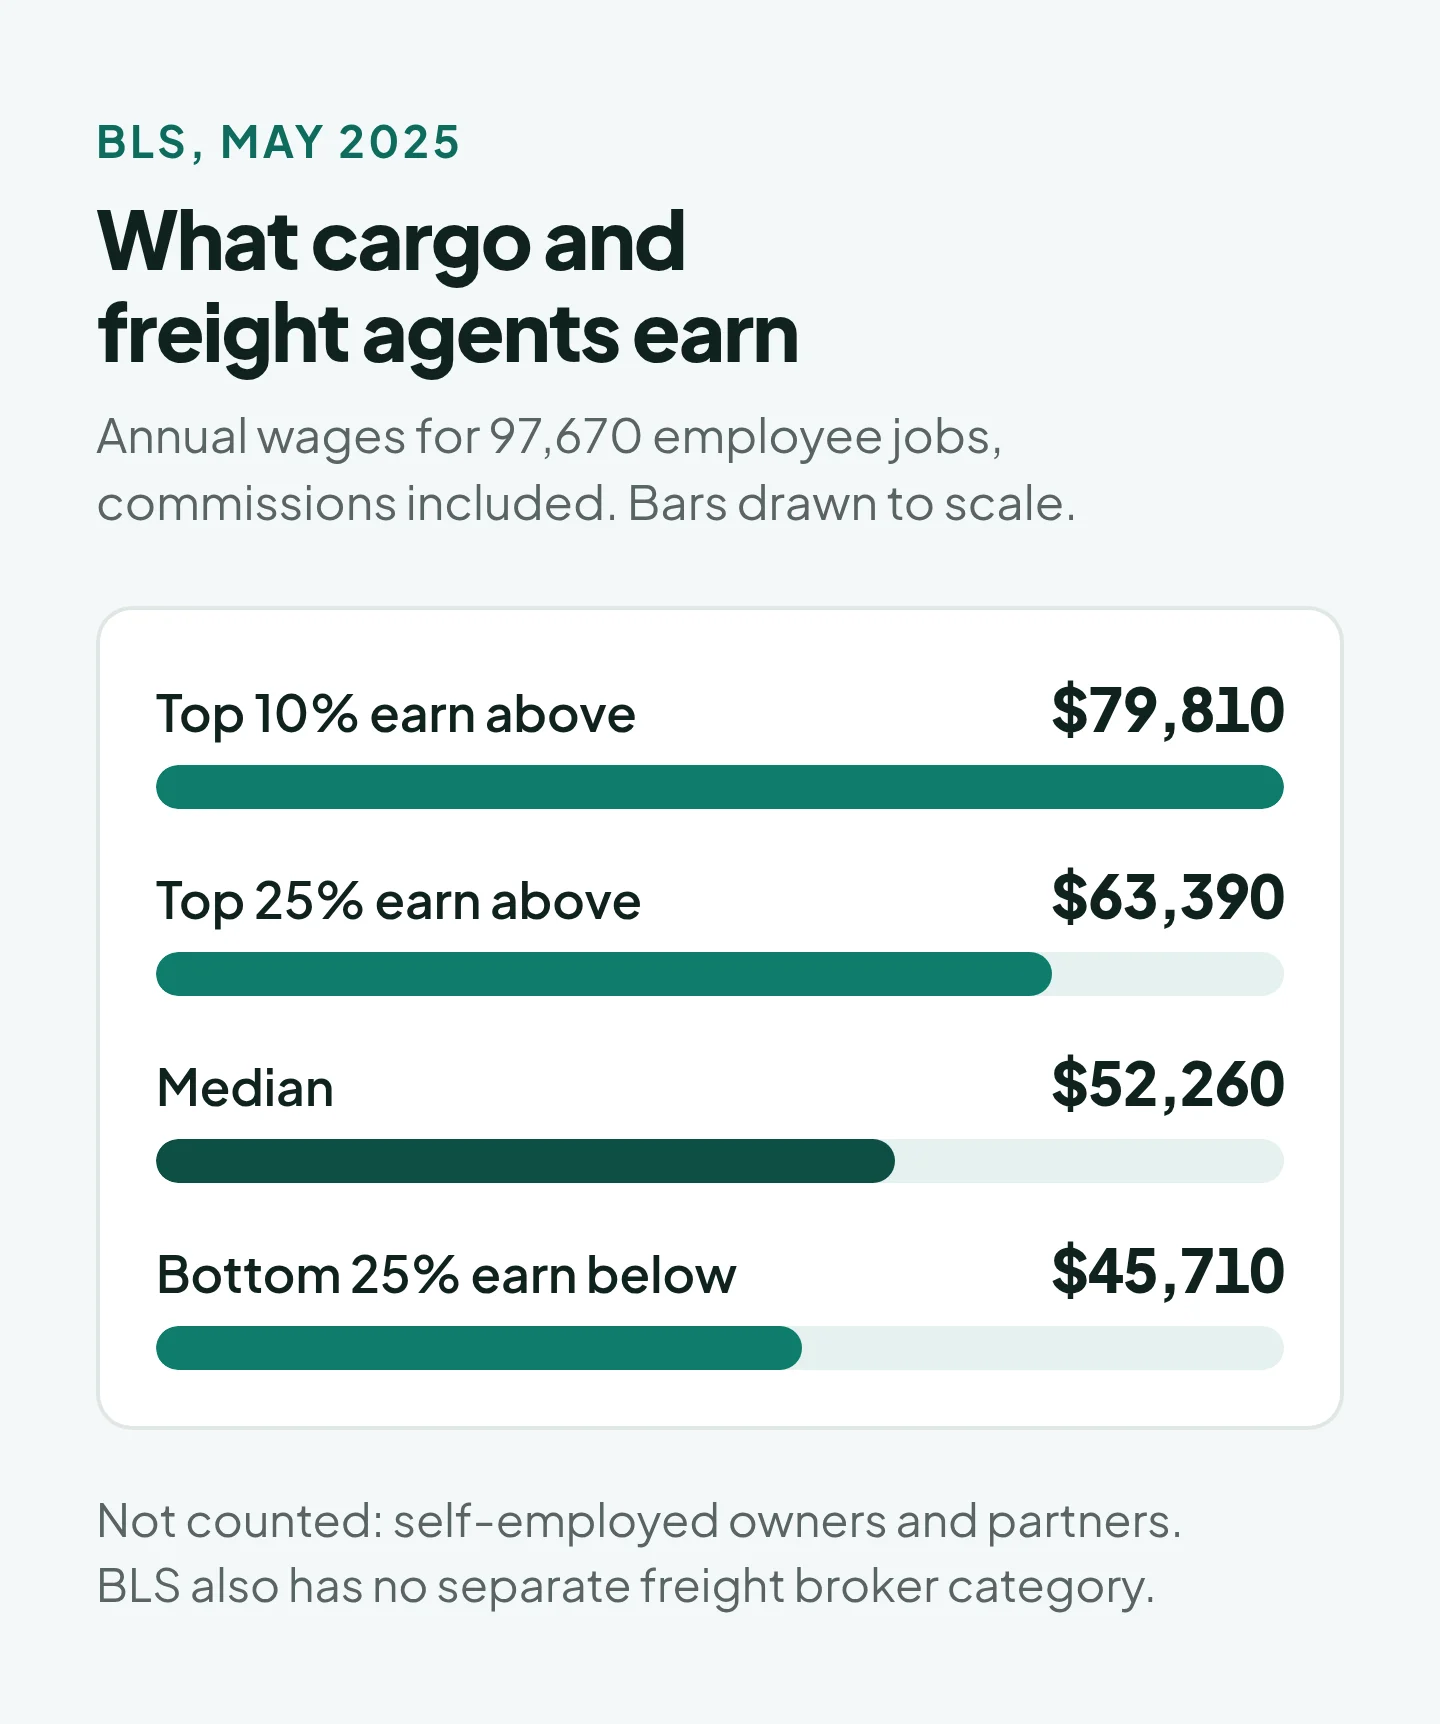
There is no official freight broker salary. The closest government figure is the Bureau of Labor Statistics category for cargo and freight agents, which had a median wage of $52,260 in May 2025, with the middle half of workers between $45,710 and $63,390. That figure includes commissions but leaves out self-employed owners. Across all private freight arrangement businesses, BLS payroll data (a CSV file) put average pay at $85,103 in 2025, up from $81,610 in 2024. Independent agents and owners have no official figure at all, because their income is a share of margin, and public data suggests it is very uneven. This page, part of our freight careers and training hub, gives each number with its date, shows how the pay plans work, and runs worked examples for all three routes.
This is general information, not legal, tax or financial advice. Pay plans vary by contract, so check your own offer with a qualified professional before you sign.
The numbers at a glance
| Measure | Figure | Date | Who it covers |
|---|---|---|---|
| Median wage, cargo and freight agents | $52,260 | May 2025 | Employees in the occupation, all industries |
| Same occupation, freight arrangement firms only | $54,730 | May 2025 | Employees of brokers, forwarders and similar firms |
| Average pay, all staff at freight arrangement firms | $85,103 | 2025 | Every employee, from clerks to executives |
| Entry-level pay stated by one large brokerage | $40,000 to $50,000 minimum first-year compensation | Listing read 1 November 2026 | One Texas sales role at TQL |
| Independent agent share of margin | Around 50% to 70%, as industry pages describe it | 2021 to 2023 | Recruiting and industry pages, not a survey |
| Owner income | No public figure | n/a | See our worked example below |
What the BLS says
The BLS wage survey for May 2025 counted 97,670 cargo and freight agent jobs (occupation 43-5011). The mean was $57,230, or $27.52 an hour, and the median hourly wage was $25.13. For comparison, the median for all US occupations was $50,980.
Three things about this data change how you should read it:
- Commissions are in. The BLS survey FAQ counts commissions and production bonuses as wages. Year-end bonuses and overtime pay are out. So this is not base salary alone.
- Owners are out. The survey does not cover the self-employed or owners and partners in unincorporated firms. Independent agents paid by commission rather than wages very likely fall outside it too, though the FAQ doesn’t name them.
- The category is broad. O*NET’s profile of the occupation lists “Freight Broker” as a sample job title, but its description is about routing freight, taking orders and checking bills of lading, and it sits among office support jobs. Its task list does start with negotiating and arranging transport. A sales-heavy broker might be reported under another code by the employer, so this data may understate the sales side of the job.
Be careful with year-on-year comparisons. BLS itself doesn’t encourage using this survey as a time series, because its methods and classifications change.
Why salary sites disagree
Search this topic and you will see figures from about $50,000 to over $80,000. They are measuring different things.
| Source | Figure shown | What it measures | Checked |
|---|---|---|---|
| BLS, occupation 43-5011 | $52,260 median | Employer survey of wages with commissions | May 2025 data |
| Payscale | $50,472 average base; total pay $36,000 to $77,000 | 111 self-reported profiles, updated 1 June 2026 | 1 Nov 2026 |
| Indeed | $65,832 average base | About 1,000 salaries taken from Indeed job postings over the past 36 months, updated 28 October 2026. An advertised salary is not always what people earn | 1 Nov 2026 |
| BLS, all freight arrangement firms | $85,103 average | All staff at those firms, including managers and executives | 2025 data |
Only the BLS figures are government data. Payscale and Indeed are shown because you will meet them, and their numbers change with each update. Treat them as a rough guide.
One more trap: some pages titled “freight broker salary” quote about $82,000. That is the May 2025 median for logisticians, a different occupation. The table below shows how far apart the neighboring jobs are.
| Occupation (BLS code) | Jobs | Median wage, May 2025 |
|---|---|---|
| Cargo and freight agents (43-5011) | 97,670 | $52,260 |
| Production, planning and expediting clerks (43-5061) | 390,160 | $59,650 |
| Sales reps of services, except advertising, insurance, financial and travel (41-3091) | 1,256,010 | $69,990 |
| Logisticians (13-1081) | 251,040 | $82,320 |
| First-line supervisors of non-retail sales workers (41-1012) | 214,390 | $87,520 |
| Transportation, storage and distribution managers (11-3071) | 221,180 | $107,230 |
The gap between $52,260 and $69,990 is one rough way to frame the job. That is our reading, not a BLS finding: a broker who mainly coordinates loads resembles the first row, and one who wins accounts resembles a services sales rep.
Pay by industry, state and city
Just over half of these jobs, 53,390, are in freight transportation arrangement, the industry that includes brokers. The table shows it beside other industries we pulled. All figures in this section come from the same May 2025 BLS release.
| Industry | Jobs in 43-5011 | Median | Mean |
|---|---|---|---|
| Freight transportation arrangement | 53,390 | $54,730 | $57,570 |
| Couriers and messengers | 9,770 | $57,660 | $58,590 |
| Air transportation | 8,880 | $49,310 | $56,380 |
| Truck transportation | 4,990 | $58,260 | $61,270 |
| Management, scientific and technical consulting | 3,290 | $49,460 | $54,780 |
| Warehousing and storage | 2,200 | $49,920 | $53,720 |
Location moves the median at least as much as the industries above do. In the ten states with the most jobs, it runs from $48,470 in Texas to $60,210 in New Jersey:
| State | Jobs | Median |
|---|---|---|
| California | 17,060 | $57,690 |
| Florida | 8,110 | $48,520 |
| Texas | 7,610 | $48,470 |
| Illinois | 6,110 | $59,750 |
| New York | 5,760 | $60,040 |
| New Jersey | 4,280 | $60,210 |
| Georgia | 3,630 | $51,380 |
| Tennessee | 3,390 | $51,800 |
| Ohio | 2,840 | $49,530 |
| Pennsylvania | 2,810 | $49,590 |
Among the metro areas we checked, Seattle ($61,860), San Francisco ($60,980), the New York area ($60,590), Chicago ($59,850), Minneapolis ($59,560), Los Angeles ($59,010) and Atlanta ($58,750) sit near the top, and Memphis is at $55,930. Miami ($48,150), Dallas ($48,690) and Cincinnati ($46,190) are below the national median. Small states can show high medians on very few jobs: Rhode Island’s $60,310 rests on 140 jobs, so don’t plan around it.
How employee brokers are paid
A common plan for freight brokers working for a brokerage is a base salary plus commission on gross margin, which is what the shipper paid minus what the carrier received. Public evidence on the terms is thin, so here is what exists, and how old it is.
- Employer listings. A TQL sales representative listing for Fort Worth, read on 1 November 2026, offers “$40,000 – $50,000 minimum compensation your first year, based on education”, uncapped commission and six months of training, in the office full time. It also says the “average sales representative hits six figures after three years of selling”. That is the company’s own recruiting claim. It gives no method, and it may count only those who stayed three years.
- The FreightWaves survey. Its survey of 286 US brokers, run in April 2022 and published that June, found a median entry-level base of $48,000. Average commission was nearly 15% of gross margin for entry-level brokers and managers, and close to 20% for executives. It is the best direct survey we found, but it is four years old and is a small sample.
- An earlier survey. A FreightWaves SONAR summary from June 2020 reported a $40,000 median entry-level base and a 13% median commission from 402 brokers.
Treat 13% to 20% as what a few surveys found, not a market rate. We found no current, independent figure.
A cross-check from a large public broker. C.H. Robinson’s 2025 Form 10-K reports $644.0 million of personnel expense for its North American Surface Transportation segment, on an average of 5,158 employees. That works out to about $125,000 a head, but it is not pay in the pocket. It is a company cost, which in the filing includes items such as stock compensation and severance, and the average takes in every role in the segment. The useful figure is the ratio: personnel took about 38% of the segment’s $1.71 billion adjusted gross profit.
Worked example, with invented round numbers. A second-year broker has a $45,000 base and a 15% commission. They move 80 loads a month at $200 margin each, or $192,000 of margin a year.
| Plan type | Commission paid on | Commission | Total pay |
|---|---|---|---|
| From the first dollar | $192,000 | $28,800 | $73,800 |
| After a $90,000 yearly margin threshold | $102,000 | $15,300 | $60,300 |
Same broker, same freight, $13,500 apart. The percentage in an offer tells you little until you ask these questions:
- Is there a threshold, and is it tied to my base?
- Is base a true salary, or a draw that is repaid out of commission?
- Is commission paid when the invoice is billed or when the shipper pays?
- Do bad debt, claims or lost loads come out of my number?
- Who owns my accounts if I leave, and what does the non-compete say?

Our guide to broker training and how to choose it explains why an employer’s paid program can be better value than a paid course.
What freight agents really earn
An independent freight agent brings the freight, books it under a brokerage’s authority, and keeps a share of the margin. We found no survey of agent income. What we have is what brokerages say about the split, plus one public filing.
The split. Trinity Logistics wrote in July 2021 that industry standards are “around 50 to 70 percent of gross margins”. Truckstop’s April 2023 post gave 25% to 70%, with an average of 50% to 65%, without a source. Both are marketing pages, and neither is a survey. Check what the percentage applies to. Landstar’s 2025 Form 10-K describes three contract types: a percentage of revenue, of revenue less purchased transportation, or of revenue less a retained percentage and purchased transportation. Those can produce very different checks from the same load.
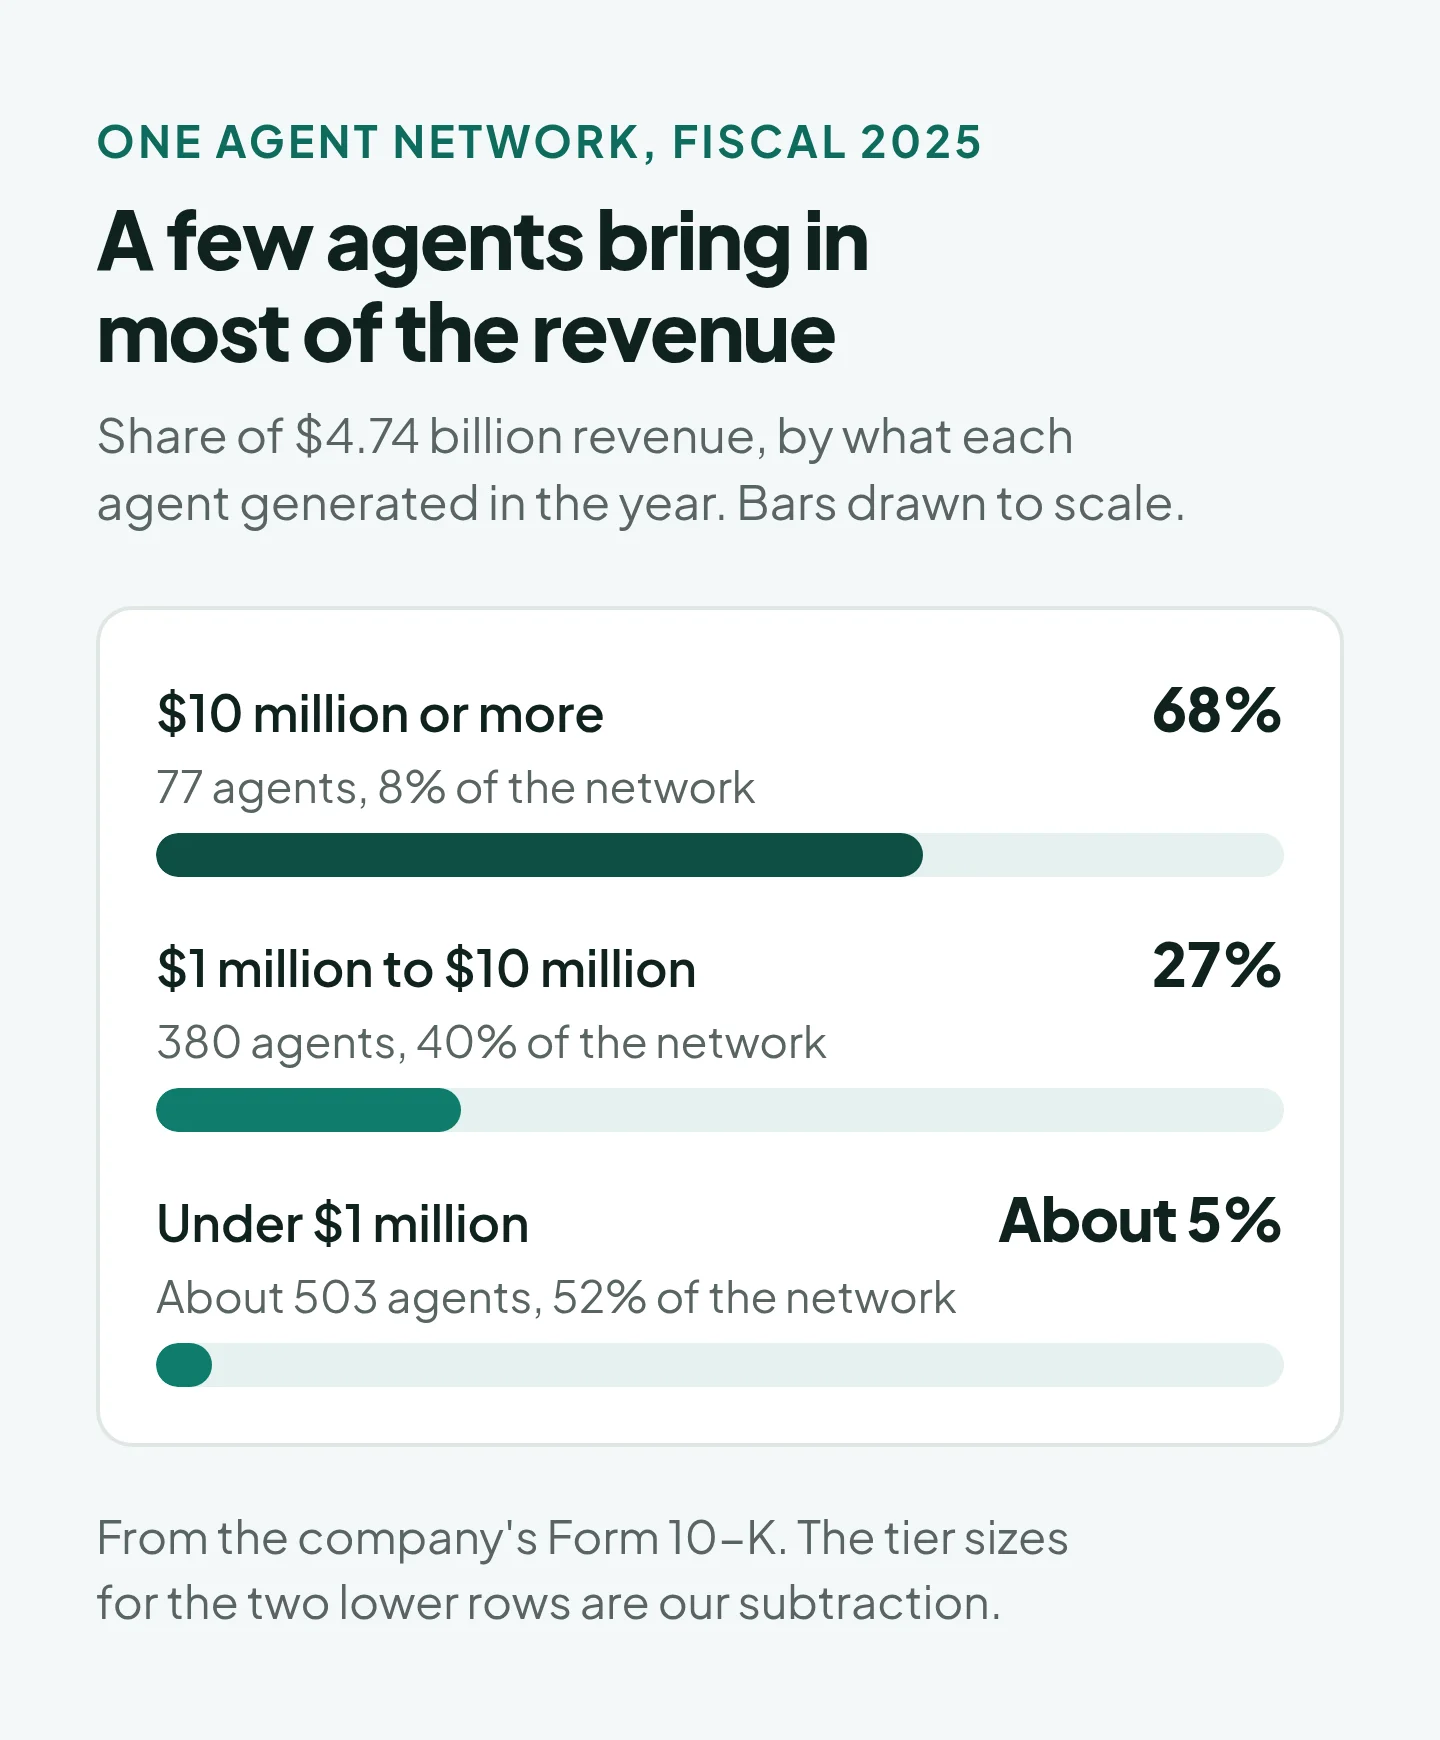
The spread. Landstar is the rare case with public agent data. In fiscal 2025 it had about 960 independent commission sales agents, $4,743.8 million of revenue and $387.4 million of commissions, or 8.2% of revenue. It said 457 agents each generated at least $1 million in revenue, together 95% of the total, and 77 generated at least $10 million. Its filing puts those 77 at about 68% of revenue.
Here is our estimate of what that means per agent, using the 8.2% average commission rate:
| Agent size | Agents | Average revenue each | Estimated commission each |
|---|---|---|---|
| $10 million or more | 77 | About $41.9 million | About $3.4 million |
| $1 million to $10 million | 380 | About $3.4 million | About $275,000 |
| Under $1 million | About 503 | About $380,000 to $470,000 | About $30,000 to $40,000 |
Read this as an order of magnitude. These are our calculations, not Landstar’s. The commission rate varies by mode and contract, and the filing’s percentages are rounded. About 1% of Landstar’s revenue is insurance-segment premiums, which we assume no agent generated, so the smallest tier is a range. Most important, these are gross commissions paid to agencies, and a big agency pays staff and costs out of its share. They say nothing about any one person’s take-home pay, and Landstar is only one company with its own model. Still, they suggest that “agents earn six figures” holds for a minority of the network, and that the average agent under $1 million collects far less.
Worked example, with invented round numbers. An agent bills $1,000,000 in a year at a 14% margin, for $140,000 of gross margin. Their split is 60%.
| Line | Amount |
|---|---|
| Commission on Form 1099 (60% of $140,000) | $84,000 |
| Own expenses, assumed (phone, computer, software) | -$6,000 |
| Net earnings | $78,000 |
| Self-employment tax (15.3% of 92.35% of net) | -$11,021 |
| Left before income tax, health cover and retirement | $66,979 |
On an $84,000 W-2 job, the employee’s share of these taxes would be $6,426, at 6.2% plus 1.45%, and the employer would pay the matching amount. The IRS’s self-employment tax topic gives the 12.4% and 2.9% rates and the 92.35% base. You can deduct half the tax when working out adjusted gross income, and you usually owe it once net earnings reach $400. A brokerage generally must report your pay on Form 1099-NEC at $2,000 or more for tax year 2026, with payments to most corporations exempt, but you owe tax on it regardless.

Three things can change that picture:
- The ramp. The same agent billing $300,000 earns $25,200 before costs. New agents without a book may take a long time to grow, and we found no public data on how long.
- Charge-backs. If your contract passes unpaid invoices back to you, one unpaid $2,000 load at this margin wipes out the commission on about 12 good ones ($168 each).
- Marketing math. Trinity’s example of a $180,000 agent assumes $2 million in sales, a 15% margin and a 60% split. Reaching $2 million is the hard part.
Being paid on a 1099 does not settle whether you are truly independent. The IRS looks at behavioral control, financial control and the type of relationship. If a brokerage sets your hours and desk but pays you as a contractor, ask an adviser about it.
What brokerage owners earn
We found no public data on small brokerage owners’ profit. The useful question is a simpler one: does running your own authority beat being an agent on the same freight?
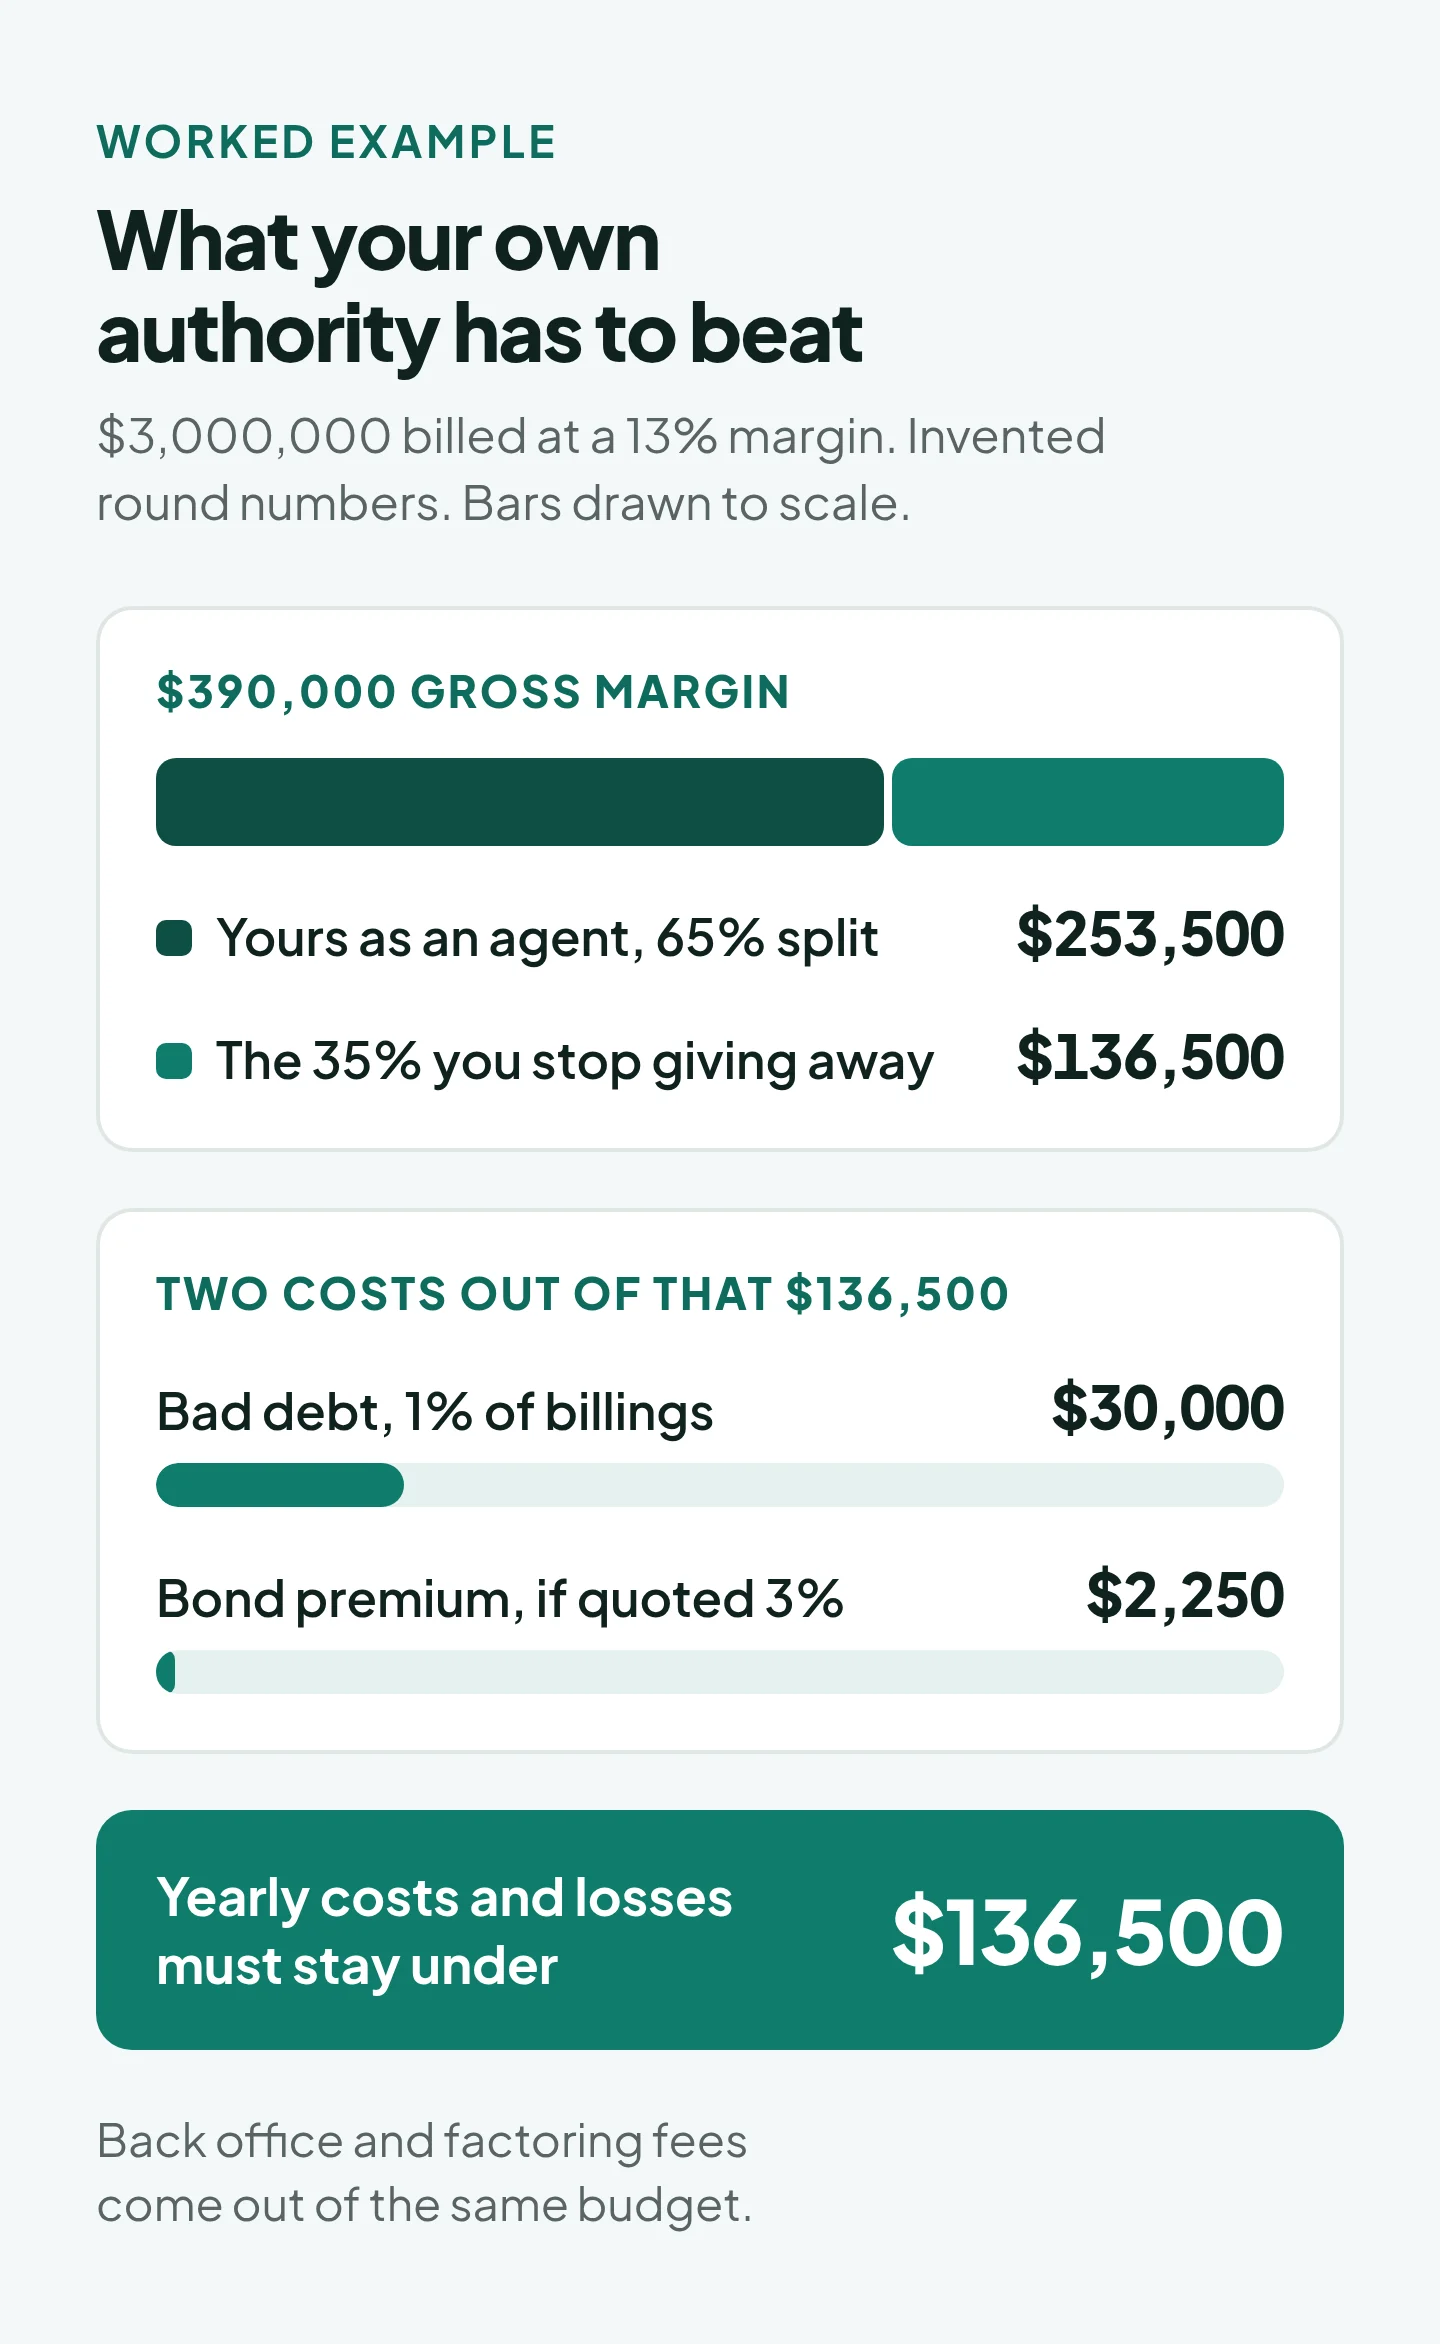
Worked example, with invented round numbers. You bill $3,000,000 at a 13% margin, for $390,000 of gross margin. As an agent on a 65% split you would keep $253,500 and let the brokerage cover its costs. On your own broker authority you keep all $390,000, then pay everything else. So the move pays only if your yearly costs and losses stay under $136,500, the 35% you stopped giving away.
That budget goes fast:
- Bad debt. Losing 1% of billings is $30,000, more than a fifth of the budget.
- The $75,000 bond. A 3% premium quote would be $2,250 a year. A claim you can’t pay is the larger risk.
- Back office. Software, load boards, optional insurance, accounting, and anyone you hire for carrier payments and tracking.
- Your own time. Hours spent on billing and collections are hours not selling.
There is also a cash problem the income figure hides. Carrier costs in this example are $2,610,000 a year, or about $217,500 a month. If shippers pay you 30 days after you pay carriers, about that much is tied up at any moment. You need that money in the bank, a credit line or a factoring facility, and factoring fees come out of the same $136,500.
What moves your income
- Margin per load. For scale, C.H. Robinson’s North American adjusted gross profit works out to 14.8% of revenue in 2025, $1.71 billion on $11.56 billion. RXO’s brokerage gross margin moved from 10.7% in the second quarter of 2026 to 12.6% in the third, as its truckload spot mix rose from 42% to 51% of volume. Gross profit per load still rose 11% at that low second-quarter percentage, then 31% in the third, each against the prior quarter. So watch dollars per load, not just the percentage. RXO has agreed to be acquired by C.H. Robinson, a deal it expects to close in the first half of 2027.
- Volume. Commission is margin times loads, so a thin month on either one shows up in your check.
- Contract and spot mix. Contract freight gives steadier volume. When truck rates rise quickly, contract margins can get squeezed because your sell price is fixed and your carrier cost isn’t. C.H. Robinson’s 10-K warns it may have to move freight at a loss when contract rates fall below market.
- Accuracy. On LTL, a wrong class can turn a profit into a loss after a reclass, so run shipments through a density-based freight class calculator before you quote.
- Role. We found no public data comparing pay in customer-facing and carrier-side roles, so ask what each one earns in the interview. If the carrier side appeals more, dispatching for trucking companies is a related job with its own route in.
Common questions
Can a freight broker make $100,000?
Yes, but it is above what most employees in the closest BLS category earn: the top 10% started at $79,810 in May 2025. TQL says its average sales representative reaches six figures after three years. That claim comes without a method. Sales roles at large brokerages and agents with an established book are the routes this evidence points to.
What does a new freight broker make?
As an employee, plan around the $40,000s to low $50,000s. BLS’s bottom quarter ends at $45,710, TQL’s listing starts at $40,000 to $50,000, and the 2022 survey’s median entry base was $48,000. A new independent agent without customers can earn much less than that, and has no base.
Do agents earn more than employee brokers?
Per dollar of margin, yes: the 50% to 70% quoted for agents is far above the 13% to 20% surveys found for employees. But the employee’s plan comes with a salary, usually benefits, and the employer’s costs covered. The agent pays both halves of payroll-style tax and buys their own benefits. So the answer depends on the size of the book. On the plan in our employee example, a $45,000 base plus 15%, a 60% split only passes that pay at about $100,000 of yearly margin, before the agent’s own costs. Above that the agent pulls ahead quickly, but the catch is having that freight at all.
Are freight broker jobs commission only?
Employee jobs usually have a base. Independent agent contracts are normally commission only, so a slow first year is yours to fund. If an “employee” job has no base, ask how it meets federal and state minimum wage rules and whether you are really a contractor.
Facts checked against primary sources on 1 November 2026: the Bureau of Labor Statistics (wage survey, May 2025, and the Quarterly Census of Employment and Wages for NAICS 488510, private sector, 2024 and 2025), SEC filings from Landstar and C.H. Robinson, RXO’s second- and third-quarter 2026 earnings releases, and the IRS. BLS state, metro and industry figures come from its May 2025 public data file. Employer, survey and salary-site figures are shown with their dates and are not independently verified. Worked examples use invented round numbers. Every figure is checked against the linked source. This page is general information, not legal, tax or financial advice.
Sources
- BLS OEWS May 2025: cargo and freight agents (43-5011)
- BLS OEWS May 2025 data tables
- BLS OEWS frequently asked questions
- BLS QCEW 2025: NAICS 488510 freight transportation arrangement
- O*NET: cargo and freight agents
- Landstar System, Form 10-K for fiscal 2025
- C.H. Robinson Worldwide, Form 10-K for 2025
- RXO second-quarter 2026 earnings release
- RXO third-quarter 2026 earnings release (29 October 2026)
- IRS Topic 554: self-employment tax
- IRS Topic 751: Social Security and Medicare withholding rates
- IRS Instructions for Forms 1099-MISC and 1099-NEC
- IRS: independent contractor or employee
- TQL sales representative listing, Fort Worth (read 1 November 2026)
- Payscale: freight broker salary (updated 1 June 2026)
- Indeed: freight broker salaries (updated 28 October 2026)
- FreightWaves: Freight Broker Compensation Survey, 2022
- FreightWaves SONAR: how much do freight brokers get paid (2020)
- Trinity Logistics: how much will I make as an independent freight agent (2021)
- Truckstop: freight broker commission (2023)